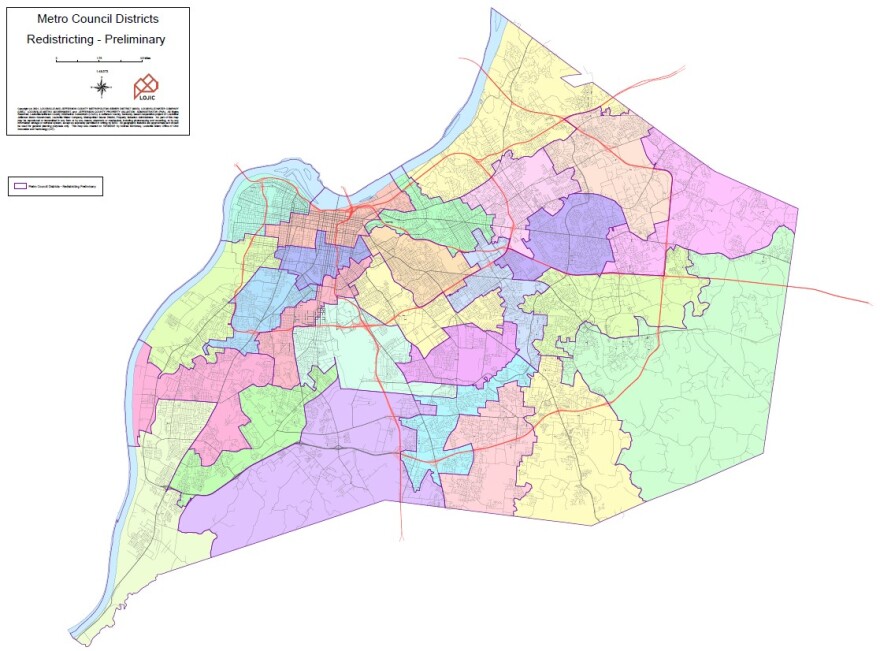
City officials unveiled the proposed new Metro Council district maps Thursday. They’re based on the most recent Census data and will decide how Louisville’s 782,000 residents are represented locally.
The voting district maps reflect an eastward shift in the population, with areas of west Louisville losing residents over the last decade. The new maps also try to maintain Louisville’s historically Black voting districts, which is required by the federal Voting Rights Act.
By law, the population in each of Louisville’s 26 local legislative districts must remain roughly equal. That means districts in parts of Jefferson County that grew in population had to be redrawn smaller. Districts that lost population were made larger to encompass more residents.
At a meeting of Metro Council’s Ad Hoc Committee on Redistricting on Thursday, council staffer Jeff Noble said the process ensures Louisville Metro Government continues to represent residents fairly. Noble led the effort to redraw the maps.
“This ensures residents have equal access to political representation,” he said.
How districts may change
The results of the 2020 Census showed that District 5, a majority Black district which includes the Shawnee, Portland and Russell neighborhoods, lost the most residents. District 19, which encompasses the Middletown area, gained the most.
Under the new maps, District 5 would extend further south to encompass parts of the Chickasaw neighborhood. District 19 would shrink, losing a sizable portion of Middletown. Those neighborhoods would join District 17, which includes the area around Anchorage.
In southeast Louisville, District 20 — Louisville’s largest district by geographic area — would shrink, losing some neighborhoods near the intersection of I-264 and I-64.
Louisville has historically had six districts with mostly Black voters, but half of them lost Black residents over the last 10 years, according to Census data. Districts 1 through 5, mostly concentrated in west Louisville, had to be redrawn to ensure they stayed more than 51% Black. District 6 will remain what’s called a crossover district, which is a voting district where Black residents are a slight minority but elections have historically been won by the candidate they preferred.
District 19 Council Member Anthony Piagentini, a Republican and the redistricting committee vice chair, noted that minority residents started dispersing throughout the county after the end of segregation. And with an increasing number of people identifying as multiple races, Piagentini said keeping majority-minority voting districts has become more difficult.
“Not that this shouldn’t continue to be a goal because of the history and what happens when you intentionally try to break up racial communities, but I think it’s a very fascinating trend and we need to watch that,” Piagentini said.
Under the 1965 Civil Rights Act, local officials are not allowed to redraw maps that dilute minority voting power.
Metro Council has until December 7th to approve the maps. They’re now asking for the public’s feedback on the proposal. Residents can respond through an online survey, or at the next Redistricting Committee meeting on October 27. Residents must sign up online to speak at that meeting.
The new maps are expected to go into effect before next year’s Metro Council elections.
The proposed maps for each council district are available here.
What’s behind the maps?
In order to redraw the district boundaries, Metro Council is using updated population data from the 2020 Census. The federal government released the findings to state and local governments back in August.
Matthew Ruther, a population geographer and associate professor at the University of Louisville, broke down the new Census numbers for the Committee. His analysis showed that the population of Louisville Metro grew by 5.7%, outpacing Kentucky’s growth as a whole.
The average Metro Council district had 30,114 residents as of 2020. But eight districts in west and south Louisville had significantly less than that. And five districts, mostly concentrated in east Louisville and the Okolona area, were well above the average.
While Louisville’s Black population grew by more than 14,000 people, Ruther said there is evidence to suggest those residents have become more dispersed throughout the county in the past decade. In District 4, which includes most of Downtown and the NuLu and Shelby Park neighborhoods, the number of Black residents declined, from 59% to 46%. Meanwhile, the Black population of southwestern District 12, which includes the Pleasure Ridge Park neighborhood, increased from 13% to 21%.
“Although there was some dispersion of the Black population, it mostly remains concentrated on the West End and southern parts of the city,” Ruther said.
The Hispanic population increased in every district across Louisville Metro, while the city’s Asian population grew mostly along the Interstate 64 corridor.
However, Ruther cautioned the Redistricting Committee not to rely too heavily on race and ethnicity comparisons between the 2020 and 2010 Census. The federal government changed questions on last year’s Census to allow people to choose more than one racial group, and Hispanic is considered an ethnicity separate from race.
The 2020 Census data also showed that many of Louisville’s largest suburban cities grew over the last 10 years. Middletown and Jeffersontown saw the largest population increases, with Middletown gaining nearly 2,500 residents and Jeffersontown gaining roughly 1,900.


